Create a Thrift Savings Plan portfolio starting with C Fund

Washington Monument

Create a Thrift Savings Plan portfolio starting with C Fund

The Thrift Saving Plan C Fund, or Common Stock index fund, is an investment fund available to federal employees with an objective to match the performance of the S&P 500 Index. The C Fund, like the S&P 500 index, covers a broad U.S. stock market index made up of 500 large and medium-sized U.S companies.

The Federal Retirement Thrift Investment Board administers the Federal Government Thrift Savings Plan and has chosen both BlackRock Institutional Trust company and State Street Global Advisors as the current asset managers for the C Fund, S Fund, F Fund and I Fund.

To track the performance of the C Fund investors can use any of these publicly available indexes or ETFs which have a very high correlation with the C Fund.

Thrift Saving Plan C Fund Ticker options
^GSPC – S&P 500 Index on Yahoo.com
SPY – SPDR S&P 500 ETF Trust
VOO – Vanguard S&P 500 ETF
IVV – iShares Core S&P 500 ETF
SWPPX – Schwab S&P 500 Index Fund
FUSEX – Fidelity Spartan 500 Index Investors Shares

Why invest in the C Fund?

TSP participants who invest in the C Fund have the opportunity to gain from owning a broad-range of U.S. company stocks. These investors will experience movement up and down in their investment along with the prices of the stock in the index. The volatility from these price changes is reduced by investing in a diversified cross section of the entire U.S. economy.

Track C Fund performance

Because TSP funds are not offered in the public market, publicly traded low-cost ETFs and mutual funds for the S&P 500 index can be used to approximate C Fund performance. 

Like the S&P 500 index, the C Fund covers a broad market index made up of stock of 500 of the largest U.S. companies and medium-sized U.S. companies.

Both BlackRock Institutional Trust company and State Street Global Advisors are the current asset managers for the C Fund, S Fund, F Fund and I Fund.

Most employees of the U.S. Federal government are eligible to participate in the TSP. To see if you qualify, see further details on the official TSP website.

Comparison to other TSP equity, bond, and lifestyle funds

In addition to the C Fund, the Thrift saving plan consists of four other core TSP funds that invest in broad equity and bond markets as well as ten lifestyle funds that as a whole offer TSP investors a wide range of options for their retirement accounts.

Of the three equity or stock funds available in the TSP, the C Fund is the most conservative. However, it has generated higher returns than both the bond fund (F Fund) and even more secure Government investment (G Fund) guaranteed by the U.S. Government.

TSP FundTSP Fund equivalent ticker symbolDescription
C FundSPYCommon Stock Index Investment Fund
S FundVXFSmall-Cap Stock Index Investment Fund
I FundEFAInternational Stock Index Investment Fund
F FundAGGFixed Income Index Investment Fund
G FundBIL or CashGovernment Securities Investment Fund

F Fund: Fixed-Income Investment Index Fund

The F Fund invests in a wide range of debt instruments, including publicly traded government bonds, corporate and foreign bonds, and mortgage-backed securities (MBS). Like other publicly available bond funds, this bond fund pays a monthly interest payment, but does not guarantee return of the investor’s principal.

G Fund: Government Securities Investment Fund

The G Fund does not follow an index and invests in special non-marketable treasury securities created specifically for the TSP by the U.S. government. The G fund is guaranteed by the U.S. Government, so there is no risk of loss, and it earns interest at a rate determined by the U.S. Treasury at a yield equivalent to short-term U.S. Treasury securities. It has the lowest risk of all the TSP core funds and is the default fund for TSP investors.

S Fund: Small-Capitalization Stock Index Fund

The S Fund holds the same securities as the Dow Jones U.S. Completion Total Stock Market Index. It contains 4,500 companies outside of the Standard & Poor’s 500 Index. When combined, the C Fund and S fund make up the companies that make up the very broad Wilshire 5000 Index. The companies in the S Fund are smaller than those in the C Fund (S&P 500 index) and so The S Fund tends to have higher volatility and has historically outperformed the C Fund.

I Fund: International Stock Index Investment Fund

The I Fund invests in international stocks based outside of the United States. It replicates the Morgan Stanley Capital International EAFE (Europe, Australasia, Far East) Index and consists of larger, more established companies located in developed countries around the world.

L Funds: Lifecycle Funds

TSP Lifecyle funds let investors with TSP accounts invest in a single TSP fund containing a combination of the five core funds. Each L Fund holds core TSP funds in a ratio determined by professionals to give the best expected return for the amount of expected risk appropriate for the year in which future funds will be needed.

TSP Lifecycle Funds are designed to simplify the investment decision by letting investors choose only one TSP fund designed for when they will retire from government service and need access to their TSP funds.

There are ten L Funds available today with retirement dates between 2025 and 2065, in five year increments.  

Every 90 days each L Fund automatically adjusts holdings of the core funds to shift funds from high risk and reward to lower risk and reward as the target date gets closer.

When the target date is reached, the L Fund is rolled into the L Income fund, which is designed for an investor who has reached their target date and may need access to their TSP funds.

TSP Lifecycle funds

  • L Income
  • L 2025
  • L 2030
  • L 2035
  • L 2040
  • L 2045
  • L 2050
  • L 2055
  • L 2060
  • L 2065

Adding C Fund to your investment portfolio

A common type of investment strategy referred to as a Strategic asset allocation is where an investor sets target allocations for various asset classes and rebalances the portfolio periodically. The target allocations are based on factors such as the investor’s risk tolerance, time horizon, and investment objectives.

The C Fund can be added to your portfolio to satisfy the need for investing in stocks of companies. In addition to holding the C Fund, investors may choose to hold other funds that invest in international stock markets such as the I Fund or the S Fund which invests in smaller companies in the U.S.

To balance stock holdings, bonds are often added to a portfolio because they are considered safer investments than stocks, but generally have lower returns. 

Historically bond index funds have had an inverse correlation to stock index funds, meaning when stocks go up, bonds tend to go down. This can help to reduce volatility in an investor’s portfolio.

Strategic investment portfolios  with different asset allocations

Type of portfolioStock Fund percentageBond Fund percentage
Conservative30%70%
Moderate60%40%
Aggressive85%15%

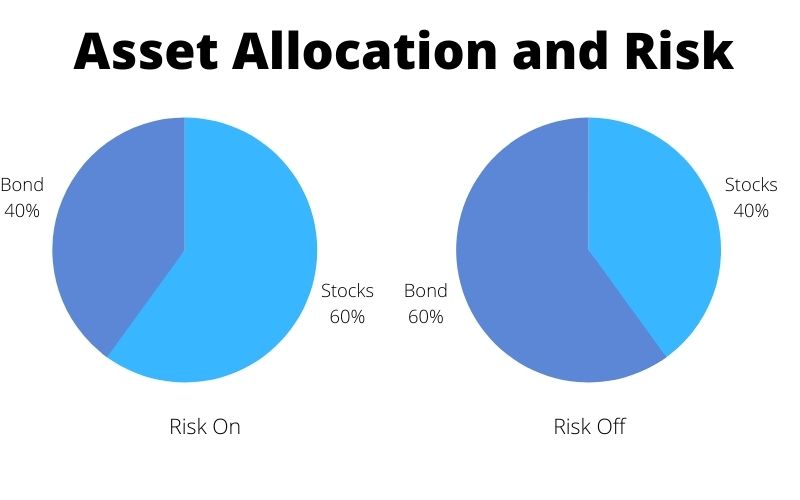
In addition to investing their TSP portfolio using a Strategic Asset Allocation (SAA) strategy, some investors chose to follow a Tactical Asset Allocation (TAA) strategy with all or some of their retirement savings.

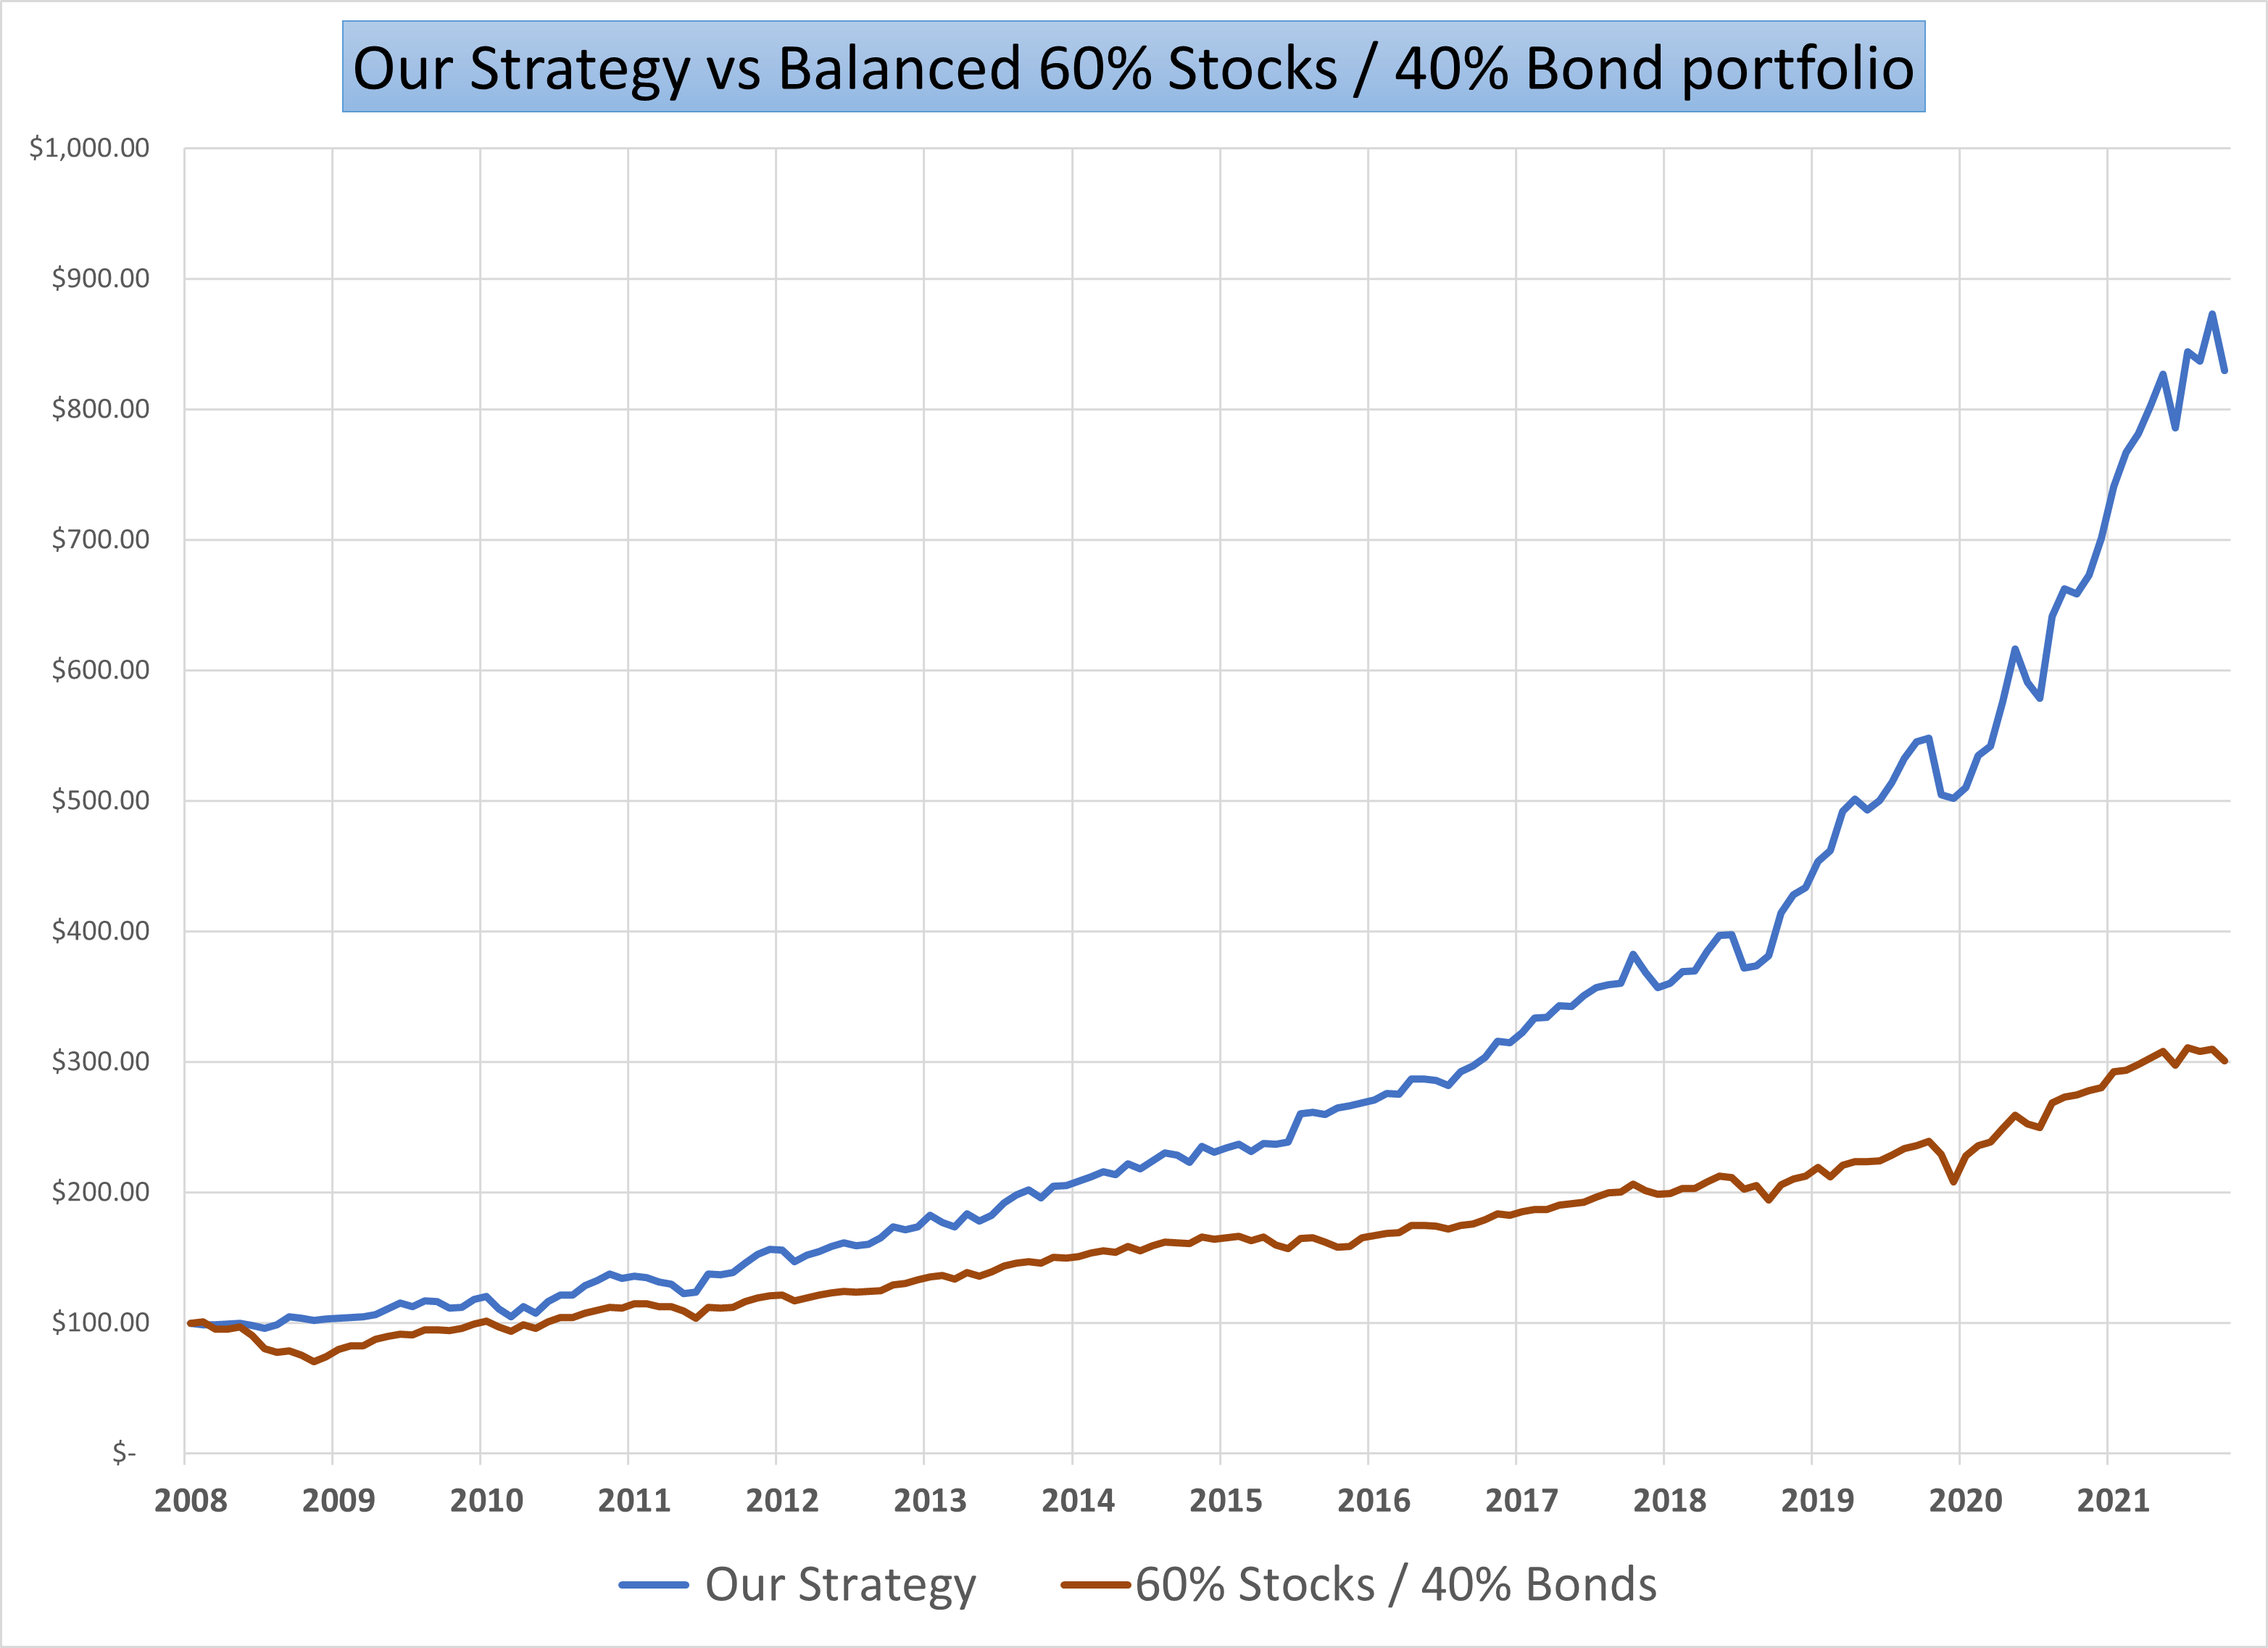
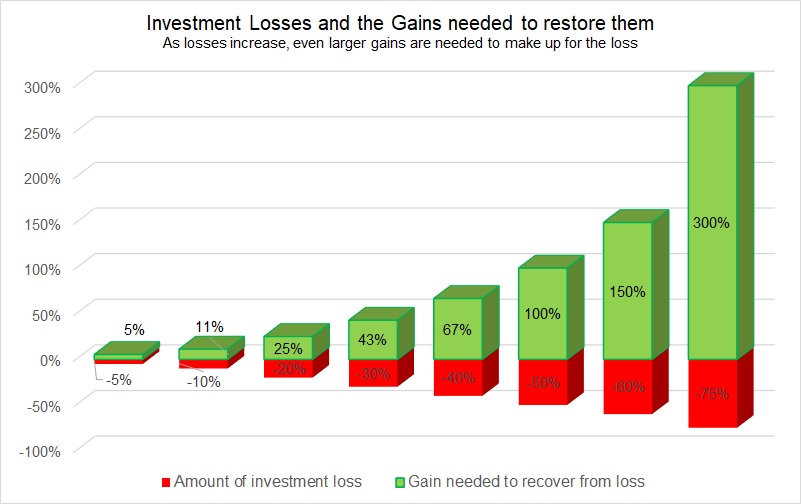
A Tactical Asset Allocation strategy differs from a SAA strategy in that at TAA actively adjusts core investment funds according to current economic conditions. The goals of most TAA strategies are to improve investment performance and to limit drawdowns and help ensure capital preservation when financial markets fall.

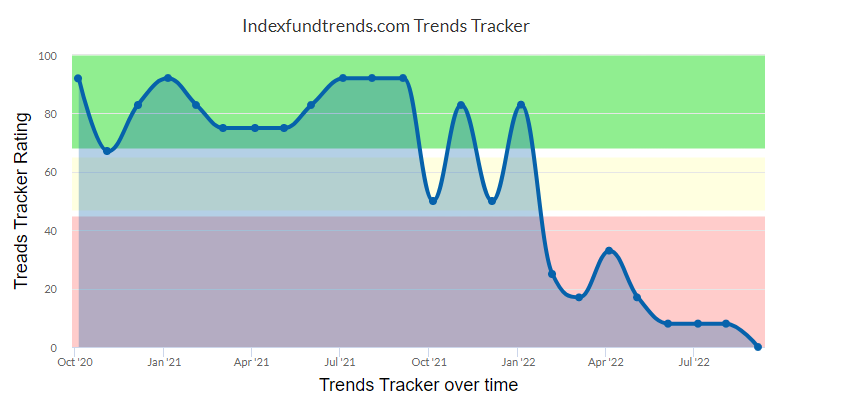
Indexfundtrends.com has an TAA investment strategy specifically designed for TSP account holders called the Dynamic TSP Strategy. It has been shown to perform better over the long run than a strategic asset allocation strategy with smaller drawdowns and good investment returns.

Get our FREE Strategy updates next month!
Sign-up today

Learn more about our Investment Strategies and view current recommendations

Click Here

Read More

Our September 2022 stock market Momentum Indicator looks Bearish!

Trends Tracker snapshot on 1 Sept 2022

Many investors are concerned about the future direction that stocks and ETFs are heading, based on recent stock market volatility and ETF performance.

This is not surprising considering that the NASDAQ 100 (QQQ) index is down approx 26% and the S&P 500 index (SPY) is down over 17% Year-to-date ( as of 02-SEP-22).

Indexfundstrends.com uses a proprietary tracker of momentum we call our Trends Tracker as a indicator of where overall stock market momentum stands at any point in time.  It is a composite measurement of momentum across more than 10 different world wide broadly based index funds.

As can be seen above by the snapshot of our Trends Tracker on September 1st 2022, momentum has largely left the stock market.  

This does not bode well for future returns of the index funds we follow.  Most of the strategies at indexfundtrends.com have moved money to safe investments a few months ago.  To see for yourself, consider a Free or Premium membership to our site.

Read More

New IFT Dual Momentum Strategy

indexfundtrends.com strategy versus balanced portfolio

New IFT Dual Momentum Strategy

Indexfundtrends.com introduces a new free strategy available to members which has been shown to outperform holding a portfolio of 60% stocks and 40% bonds.  

This new strategy is based on the strategy created by Gary Antonacci and discussed in his book Dual Momentum Investing. 

The strategy utilizes the phenomenon of momentum to improve investment performance and reduce risk. 

On a monthly basis, it analyzes performance of very broad stock market indexes to determine the best investments to hold for the next month.

indexfundtrends.com strategy versus balanced portfolio

In time of economic uncertainty like today, we strongly encourage investors to educate themselves on strategies that have the potential to limit risk and boost returns.

The IFT Dual Momentum Strategy is available for free to members of indexfundtrends.com

Stock market performance is measured at the end of each month to determine holdings for the next month.  An  email is sent to members at the end of each month as a reminder.  During many months, no changes in holdings are required to follow the strategy. 

This new strategy along with more advanced strategies are available with a paid membership at indexfundtrends.com

Get our FREE Strategy updates next month!
Sign-up today

Learn more about our Investment Strategies and view current recommendations

Click Here

Read More

Five asset allocation strategies to avoid a stock market crash

asset allocation and risk

Five asset allocation strategies to avoid a stock market crash

How do market crashes affect investment portfolios?

Stock market crashes can be devastating for individual investor investment portfolios.  

As can be seen in the chart below, as the loss from a stock market crash grows larger, the farther behind an investor becomes. The percentage gain required to get back to where they started grows at an even faster rate.  

What is a Drawdown?

A drawdown is the loss or drop in value of an investment or account from a high or peak value until it recovers back to the same high.

Referred to as a percentage, two key elements must be considered:

  • Time – how long will it take to recover from the loss
  • Money – the dollar amount of the loss

Drawdowns are a vital factor that is often overlooked when evaluating different investment options.  Unfortunately there is no requirement that they be reported to investors.

Investors nearing retirement may not have the luxury of time to recover from a large drawdown.  If drawdowns can be minimized, then  investments can continue growing sooner after a stock market crash.

Indexfundtrends.com reports drawdowns for all their strategies and also allows members to compare strategies with other investments.

Rule No.1: Never lose money. Rule No.2: Never forget rule No.1.

Here are five strategies on indexfundtrend.com that all reduce portfolio drawdowns

1. Dynamic U.S. Market Strategy

This strategy invests in the S&P500 index, which comprises 500 of the largest U.S. publicly traded companies and represents approximately 80% of the overall U.S. stock market. An S&P500 index fund or like-fund is available in most investor accounts. This strategy, despite outperforming buy-and-hold investment portfolios, has had only a small number of trades per year, making it easy to follow.


The maximum drawdown for the Dynamic U.S. Market strategy is -13.0%.

Get our FREE Strategy updates next month!
Sign-up today

Learn more about our Investment Strategies and view current recommendations

Click Here

2. Dynamic TSP Strategy

The Dynamic TSP Strategy is designed to generate higher returns and minimize losses for employees of the U.S. Government who invest with Thrift Savings Accounts. Stock market performance is evaluated each month and determines the strongest performing funds at the time.

Investment fund recommendations are then made for the next month in the TSP account. Unlike traditional buy and hold (or static allocation) strategies, the Dynamic TSP Strategy can improve returns and minimize losses by increasing allocation to assets expected to outperform and reducing allocation to assets expected to underperform.

The maximum drawdown of the Dynamic TSP strategy is -15.1%.

3. 20 x 5 Strategy

The 20 by 5 Strategy is designed to gradually increase holdings in stocks as market momentum gets stronger. It increases and decreases holdings in 20 percent increments. Stock market performance is evaluated each month and determines the strongest performing funds at the time. Investment fund recommendations are then made for the next month. Unlike traditional buy and hold (or static allocation) strategies, the 20 by 5 Strategy can improve returns and minimize losses by increasing allocation to assets expected to outperform and reducing allocation to assets expected to underperform.

The maximum drawdown for the 20 by 5 Strategy is -16.7%.

4. Dynamic Sector Strength Strategy

This aggressive global momentum investment strategy is designed to invest most funds domestically in U.S. based investments including the S&P500 index, and NASDAQ 100 index (QQQ), heavily weighted in U.S. based technology companies, or internationally in either developed foreign markets and emerging markets. Up to 85% of funds can be invested in the index with the strongest recent performance.

In addition, up to 15% of funds can be invested in a less diversified sector index (described below), when that sector is performing strongly. The strategy will switch to the safety of government bonds or cash when performance of U.S or foreign markets turns down.

The maximum drawdown for the Global Dynamic Sector Strength Strategy is -19.7%.

5. Dynamic Technology Strategy

This aggressive global momentum investment strategy is designed to invest funds in U.S. based investments including the S&P500 index, and NASDAQ 100 index (QQQ), heavily weighted in U.S. based technology companies, or internationally in developed foreign markets and emerging markets. This is a particularly aggressive strategy in that it invests all the funds each month in the top performing index fund.

The strategy will switch to the safety of government bonds when performance of equity markets slows down.

The maximum drawdown for the Dynamic Technology Strategy is -15.1%.

Read More

Benefits of adding Sector Funds to investment portfolios

Benefits of adding Sector Funds to investment portfolios

What are sector funds?

A sector fund focuses investments in businesses that operate in a particular industry or sector of the economy. Sector funds can exist as ETF’s, ETN’s or Mutual Funds.  By focusing investments in a smaller portion of the economy, sector funds enable investors to concentrate their investments in an area of the economy that can grow faster than the economy as a whole.   A sector fund is not as diversified as a broader index like the S&P 500, and thus is more volatile. This can lead to potentially greater gains, but with the risk of greater losses.

Why should you consider investing in sector funds?

Our Global Dynamic Sector Strategy invests up to 15% of its portfolio in sector funds that demonstrate the best recent price momentum.  This has allowed the strategy to outperform our other strategies over a 20 year period.

Investment Strategy / Fund20 year annualized return
Dynamic Sector Strength Strategy12.6%
Dynamic TSP Strategy10.7%
Dynamic US Market Strategy9.3%
S&P 500 Index (SPY)7.1%
Vanguard Balanced Fund (VBINX) 60/40 Stocks/Bonds6.7%

*Returns above as of June 2020

Below is a table showing the sectors chosen by the Global Dynamic Sector Strength Strategy on a year-by-year basis.

YearSector Tickers# Months invested during year
1998EWS - iShares MSCI Singapore Capped ETF1
1999EWS - iShares MSCI Singapore Capped ETF4
2000XLE - Energy Select Sector SPDR ETF
XLF - Financial Select Sector SPDR ETF
3
20010
2002EWY - iShares MSCI South Korea Capped ETF2
2003EWZ - iShares MSCI Brazil Capped ETF
IBB - iShares Nasdaq Biotechnology ETF
SOXX - iShares PHLX Semiconductor ETF
10
2004EWZ - iShares MSCI Brazil Capped ETF
XLE - Energy Select Sector SPDR ETF
9
2005EWY - iShares MSCI South Korea Capped ETF
EWZ - iShares MSCI Brazil Capped ETF
XLE - Energy Select Sector SPDR ETF
11
2006EWZ - iShares MSCI Brazil Capped ETF
XLF - Financial Select Sector SPDR ETF
XLY - iShares MSCI South Korea Capped ETF
EWS - iShares MSCI Singapore Capped ETF
9
2007EWS - iShares MSCI Singapore Capped ETF
EWZ - iShares MSCI Brazil Capped ETF
9
20080
2009GDX - VanEck Vectors Gold Miners ETF
EWZ - iShares MSCI Brazil Capped ETF
EWS - iShares MSCI Singapore Capped ETF
XLF - Financial Select Sector SPDR ETF
8
2010EWZ - iShares MSCI Brazil Capped ETF
XLY - iShares MSCI South Korea Capped ETF
GDX - VanEck Vectors Gold Miners ETF
FDN - First Trust Dow Jones Internet ETF
XLE - Energy Select Sector SPDR ETF
7
2011XLE - Energy Select Sector SPDR ETF
IBB - iShares Nasdaq Biotechnology ETF
7
2012IBB - iShares Nasdaq Biotechnology ETF
XLF - Financial Select Sector SPDR ETF
12
2013FDN - First Trust Dow Jones Internet ETF
XLF - Financial Select Sector SPDR ETF
IBB - iShares Nasdaq Biotechnology ETF
12
2014IBB - iShares Nasdaq Biotechnology ETF
SOXX - iShares PHLX Semiconductor ETF
GDX - VanEck Vectors Gold Miners ETF
EWZ - iShares MSCI Brazil Capped ETF
12
2015IBB - iShares Nasdaq Biotechnology ETF
GDX - VanEck Vectors Gold Miners ETF
FDN - First Trust Dow Jones Internet ETF
7
2016GDX - VanEck Vectors Gold Miners ETF
EWZ - iShares MSCI Brazil Capped ETF
SOXX - iShares PHLX Semiconductor ETF
9
2017SOXX - iShares PHLX Semiconductor ETF
XLF - Financial Select Sector SPDR ETF
EWY - iShares MSCI South Korea Capped ETF
11
2018SOXX - iShares PHLX Semiconductor ETF
FND - First Trust Dow Jones Internet ETF
6

As you can see, this strategy was not invested in any sectors during the 2001 and 2008 bear markets.  

Interestingly, the strategy was invested in the iShares NASDAQ Biotechnology Index ETF (IBB), shortly after Obamacare was enacted (signed into law by on March 23, 2010) during the years 2011-2015 and took advantage of the growth in the healthcare industry that resulted from the new law.

Get our FREE Strategy updates next month!
Sign-up today

Learn more about our Investment Strategies and view current recommendations Click Here
Read More

Three Country ETFs that beat the S&P 500 in 2018

Wow, what a difference a year makes in the stock market.  While 2017 was a banner year for many foreign ETF‘s as well as the S&P 500, 2018 performance was quite different.  The U.S. stock market experienced a loss for the year, while the only foreign markets to experience any growth were in the middle east.

SymbolNamePercent Return
QATiShares MSCI Qatar ETF20.1
KSAiShares MSCI Saudi Arabia ETF13.1
GULFWisdomTree Middle East Dividend Fund11.2
SPYS&P 500 index-4.4
Read More

Six Foreign Country ETFs that beat the S&P 500 in 2017

Seoul, South Korea

Last year was a big year in foreign markets for US investors. In 2017 many country ETFs outperformed the S&P 500 index (SPY).

The following is a list of the more popular ETFs.

ETF NameSymbol2017 return (%)Approx 21-day volume
iShares MSCI South Korea Index FundEWY45.72138m
WisdomTree India EarningsEPI40.8743m
IShares China Large Cap ETFFXI38.98536m
iShares MSCI Germany Index FundEWG30.3398m
iShares MSCI Taiwan Index FundEWT26.74106m
iShares MSCI Japan Index FundEWJ25.24455m
SPDR S&P 500SPY23.5921b
Read More